|
Social Conditions in Britain in the 1930s |
Introduction |
|
There is a popular impression of the 1930s as a period of unbroken depression, deprivation and decay. However, on the contrary, the 1930s was a period in which social conditions were generally improving: people were better dressed, new houses with gardens were built, motorcars started to become popular. It was also a period in which mass culture developed: the BBC, and pop music.
|
|
Employment and unemployment |
|
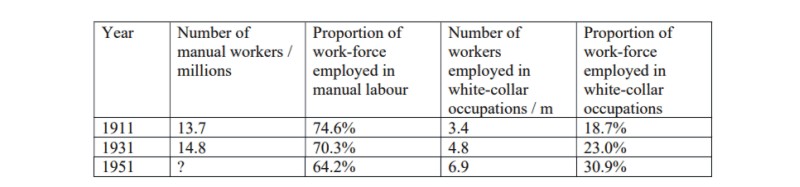
The period of the 1930s saw significant changes in the occupational distribution of the labour force. The process of deindustrialisation was at work — that is, the proportion of the work-force employed in manual labour was declining, whilst there was a growth of white-collar workers.
|
|
|
|
|
Proportion of white collar workers 1911 — 1951
|
|
|
Types of growing white-collar employment: (1) move towards new industries, typified by Imperial Chemicals Industries (founded 1926) requiring more technicians; (2) expansion of retailing — for example, chain stores of Woolworth's, Marks and Spencer's and Boots; (3) growth of clerks: 4.5% of labour force in 1911 to 6.7% in 1931.
|
|
|
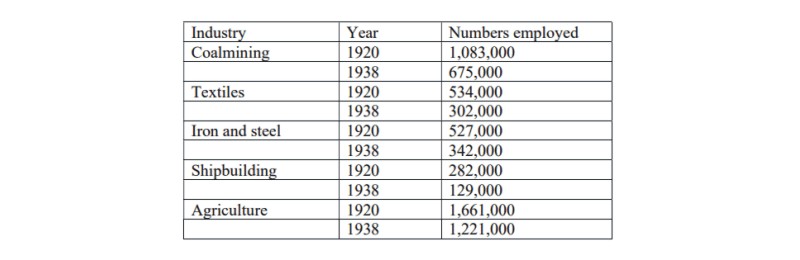
There had been a decline of the traditional manufacturing industries of Victorian Britain. There was also a decline in agriculture.
|
|
|
|
|
British industry comparative statistics for 1920 and 1938
|
|
|
By contrast, there was an increase in the numbers employed in the "new" technology based industries. The Central Electricity Board was established in 1926.
|
|

|
|
|
Growth of new industries 1930 — 1938
|
|
|
The number of women in employment also increased although the proportion decreased:
|
|

|
|
|
Female employment 1911 — 1951
|
|
|
During the First World War there was an increase in employment of women, and the First World War accelerated the movement towards employment of women.
|
|
|
The general underlying trend in numbers employed within the U.K. was upwards: 1920: 19.5m; dropping back to 17.4m in 1921; rising to 21.8m by 1939; the early 1930s created only a temporary setback. The National Government election manifesto of 1935 stated, "more persons are now employed in this country than ever before in its whole history."
|
|
|
However, although these figures do indicate that there was an increase in employment generally in Britain, the period was also characterised by high levels of unemployment. From 1881 to 1913 the average unemployment rate was 4.8%; from 1921 to 1939 it was 14% which is a significant difference even taking into account that the figures were calculated differently for the two periods.
|
|
|
One cause of the increase in the underlying rate of unemployment was the effect of violent oscillations in the trade cycle to which Britain was particular vulnerable, since a large proportion of Britain's output was traded. After the First World War there was a decline in demand for Britain's traditional products of textiles, iron and steel, coal and shipbuilding. Just after the conclusion of the war there was a speculative bubble in Britain, but this burst in 1921 and unemployment rose to a peak of 16.9% in 1921. Exports declined because of falling world prices of the primary producing products of Latin American, Africa and Asia, causing a corresponding decline in demand for British goods. After the Wall Street crash of October 1929 there was a collapse of American demand, and a further collapse of demand from the primary producers. Unemployment rose to 22.1% in 1932. The subsequent fall of the price of raw materials and food helped Britain out of the bottom of the cycle by helping to lower costs. Recovery peaked in 1937, but was sustained by the boom in arms manufacture.
|
|
|
The highest levels of unemployment occurred in the traditional export industries. In 1932, 35% of coalminers, 31% of cotton workers, 36% of pottery workers were unemployed.
|
|
|
Most of the unemployment was cyclical: most of the unemployed were only unemployed for less than six months. However, there was also structural unemployment — unemployment due to long-term decline of certain industries, exacerbated by the inability of the factor markets to adapt — i.e. workers were unable to migrate to regions where demand for labour was greater, and capital was unable to relocate in regions were labour was in excess supply. Evidence for the existence of this long-term structural unemployment: official unemployment rate at the top of the trade cycles in 1929 and 1937 were 10.4% and 10.8% respectively. Unemployment rates in declining industries were greater than the national average: in 1929, 25% of shipbuilders and repairers were unemployed; 19% of coalminers; 17% of iron and steel workers; 13% of cotton workers, with similar figures in 1937.
|
|
|
The problem of structural unemployment was exacerbated by the unnatural increase in demand during the First World War for the products of the industries that were otherwise in long-term decline: iron and steel, clothing for uniforms; coal for power, and ships. After the First World War the long-term trend re-established itself with a vengeance — and British coal, for example, was unable to re-establish its share of the international market. Additional causes affecting this trend were: (1) increasing international competition in the products of the declining industries; (2) return to the gold standard in 1925 resulting in over-valued sterling, and hence depressing demand for UK exports; (3) development of protectionism; (4) changes in patterns of demand: e.g. change in demand from cotton to man-made fibres and from iron to steel.
|
|
|
To some extent British industry tried to respond to these changes: The Lancashire Cotton Corporation was established in 1929 with a view to reducing the size of the industry; in 1936 legislation required the cotton industry to actually destroy surplus textile machinery. There were similar approaches in the coal and shipbuilding industries during the 1930s. The protective tariff given to the iron and steel industries during the 1930s was on the understanding that it would close plants and reduce excess capacity. Such schemes of rationalization resulted in more unemployment, and this, in tern, led to greater structural unemployment.
|
|
|
Evidence of increasing structural unemployment: in September 1929, 45,000 of unemployed workers had been unemployed for more than 12 months; in August 1932 this was 412,000 (16.4% of those out of work).
|
|
|
Structural unemployment was exacerbated by developments and rigidities in the labour and capital markets. (1) There was an increase in the numbers seeking work: working population increased in Great Britain by 6.5 m between 1911 and 1931. (2) Difficulties in transferring skills — e.g. a miner could not easily adapt to the work of an electrical engineer. (3) Preference of employers for younger and cheaper workers. Long-term unemployment was greater among the middle-aged: in 1931 13% of men between 25 and 44 were unemployed, but 22.6% of men between 55 and 64 were unemployed. (4) Difficulties of mobility: the declining industries were located in the North and West, but the expanding industries were located in the Midlands and South East. Between 1932 and 1937 half the new factories of Great Britain were located in Greater London. In 1937 unemployment in London, the South East and the Midlands was 6 or 7%, whilst it was 22.3% in Wales. The government attempted to respond by creating Special Areas for investment — for example, Team Valley near Gateshead.
|
|
|
The most devastated areas were those dependent on a single industry — for example, Barrow-in-Furness, which was dependent on shipbuilding, or the coal-mining town of Rhondda in South Wales.
|
|
|
One response of workers was to migrate to other regions where employment opportunities were better. This is shown by differences in population changes by region:
|
|

|
|
Population changes in Great Britain between 1921 and 1937 — by region
Economic recovery |
|
Economic recovery during the 1930s had little to do with government direction; in fact, government and people were often out of step during this period. For instance, whilst government policy strove to revive depressed areas, people decided to leave them. Government policy sought to encourage investment abroad, but the people spent their money on domestic goods. There was also a decline of interest in the empire, and with it a decline in emigration, from 100,000 per annum before the war; during the 1930s an average of 20,000 per annum returned!
|
|
|
The changes in English society at this time are reflected in J.B. Priestley's book, English Journey. He identified two traditional communities: (1) the community of the country, with squires and “yokels”; (2) the community of the industrial towns, with “mean streets” and grime. But, in addition, he found a third type of English community: (3) “the England of the twentieth century, shapeless, unplanned, yet representing the ideal towards which all Englishmen unconsciously moved.”
|
|
|
Industrial development was located mainly on the fringes of great cities. London was the main focal point, and by 1938 54% of insured workers came from the area surrounding and including London, as opposed to 46% in 1923. Other large cities, such as Manchester, also stimulated this kind of development. Inner cities declined. New industrial development catered for the domestic rather than the export market. Cotton as an export declined from third place in 1924 to 11th place in 1935, whilst motor car exports rose from 8th to 4th in the same period. Coal remained the single largest export industry, but its relative importance was declining. Employment within cotton, shipbuilding and coal mining declined by 1/3rd during the period from 1933 to 1939. There was very little decline in the new light industries as a result of the Depression, since real wages were hardly affected by it. Employment in these industries, once the recovery set in, rose by 40% as opposed to the national average of 10%. Industrial workers were increasingly able to secure jobs with holidays with pay — 11 million by 1939. There was no increase in the number of private domestic servants, and only 5% of households had a resident domestic servant between the wars.
|
|
Family income and expenditure |
|
Figures for national expenditure on goods and services indicate that for the majority of British people there was rising expenditure, which is indicative that for the majority there was a rising standard of living. There was also an increase in the quantity of food consumed. Prices of food in real terms were falling, and at the same time national expenditure on food rose from £834m in 1920 to £1,177m in 1929. At the same time, food expenditure as a proportion of the average family's budget was decreasing; expenditure on clothing increased.
|
|
|
There were 4.3m new houses built during the inter-war period. Expenditure on furniture rose, and new electrical appliances became common during the period. Sales of vacuum cleaners were 200,000 per annum in 1930 rising to 400,000 per annum in 1938. Sales of electric cookers tripled between 1930 and 1935. Number of radio licences increased from 3m in 1929 to 9m in 1930. Consumer expenditure was stimulated by the development of credit — for example, the development of hire purchase. Consumption of alcohol per head decreased during the period, but cigarette smoking increased. There was a growth in the number of dance halls. Gambling increased, with the football pools doing particularly well — by 1938 10 million people gambled regularly with the football pools. Greyhound racing developed following the introduction of the first greyhound racing track at Belle Vue in Manchester in 1926. Cinema became particularly popular — for example, in one survey it was found that 40% of Liverpudlians went to the cinema at least once a week, and 65% went once every two weeks.
|
|
|
GDP per head grew at a historically rapid rate during the inter-war period:
|
|

|
|
|
GDP per head
|
|

|
|
|
Rate of growth of GDP per head
|
|
|
There was considerable investment between the wars in new technology, which raised productivity.
|
|
|
The war period saw an improvement in real wages — by 1920 money wages were three times higher on average than before the war, but prices did not rise quite as much, and there was an improvement in real wages. The depression did not entirely erode these improvements. During the depression employers exerted a great deal of pressure on workers and there were falls in money wage rates. Thereafter, wages rates improved. But at the same time there was deflation in prices too, so real wages remained above the pre-war levels: by 1938 they were as much as 30% higher than during 1913. At the same time the average working week fell from 54 hours per week to about 48 hours per week. Whilst the poor paid relatively more in tax, and were also punished by high duties on tea, sugar, tobacco and alcohol, on the whole the income of the working classes improved.
|
|
|
The inter-war period was very good to middle-class, white-collar salary earners. The tax burden on this class, earning between £250 and £1000 per year, did not increase. Additionally, the number of white-collar occupations did increase, and some members of the class were recruited from the working-classes. This group enjoyed usually more secure jobs and better working-conditions. There was a decline in the number of domestic servants, but the middle-classes enjoyed the benefits of new electrical appliances: vacuum cleaners, gas and electric cookers, refrigerators, water-heaters. "Daily helps" remained in abundant supply and were not expensive.
|
|
Demographic trends |
|
There was a decline in the growth of the population — to less than 0.5% per annum. The birth rate declined to 16 per thousand in the 1920s, and then to 15 per thousand in the 1930s.
|
|

|
|
|
Birth-rates in England and Wales
|
|
|
The figures were slightly higher in Scotland but followed the same trend.
|
|
|
The main cause of the increased affluence was the decline in the birth rate. Thus, there was a fall in the number of children per marriage. There was also a decline in the number of large families. The decline in fertility is mainly attributed to the development of contraception. This also marked an emancipation for women. The first birth control clinic was opened by Marie Stopes in 1920.
|
|
Poverty
|
|
|
However, there was still a great deal of poverty. Rowntree defined the concept of relative poverty, and included minimum expenditure on beer, tobacco, a wireless, newspapers and other personal items within his definition of the relative poverty line. By this criterion, he estimated that 31.1% of the working-class population of York were living in poverty in 1936; similarly, there were 17.3% living in relative poverty in Merseyside during 1929-30; 20% in Southampton in 1931, and 10.7% in Bristol in 1936. A study of several conurbations in 1923-4 indicated that the number of working class families below the poverty line had fallen by a half during since 1914. A study of London in 1928 showed that the numbers in poverty had fallen to 1/3rd of the level in 1889-91. Rowntree's study of York indicated that 15.5% of the working class were in poverty in 1899, but 6.8% were in poverty by 1936.
|
|
|
The main causes of poverty were: (1) low wages; (2) sickness or death of the main breadwinner; (3) low levels of relief available from the national health insurance scheme and widows' pension scheme; (4) old-age and inadequate state pensions, coupled to increasing numbers of people living to old age; (5) large families; (6) unemployment.
|
|
|
Unemployment assistance was 45-66% of average former wages — but this was not sufficient to maintain a family above the relative poverty line.
|
|
|
Large families were a major cause of poverty. Birth-rates remained higher among working-class families than among middle-class families. Rowntree showed that over half the working-class children born in York in 1936 were born into poverty. Families would emerge from poverty when one or more children started to become wage-earners, but would sink back into poverty when the children became parents in their turn. Old-age would mark a further decline into poverty.
|
|
|
Since unemployment was a major cause of poverty, it followed that poverty was greater in depressed regions. Thus the North and West were areas of greater poverty. This reversed the pattern of C19th, when these were the growth areas.
|
|
Housing |
|
Between 1920 and 1938 nearly £2500m was invested in domestic construction in the U.K, resulting in about 4.3m houses being built - 1.5m in the 1920s and 2.5m in the 1930s. This meant that by 1939 one family in three lived in an interwar house. 2.5m of the new houses were built privately. During the 1930s the fall in prices of raw materials caused a fall in the price of housing - a £1000 house in 1920 cost £400 in the late 1920s and early 1930s. Mortgages were very easy to obtain - during the 1930s interest rates were as low as 4.5%. The number of borrowers in England and Wales increased from 554,000 in 1928 to 1,392,000 in 1939. Deposits on houses also fell from 25% of the purchase value to 5%. This resulted in a rise in home-ownership from 10% of families in 1914 to 31% by 1939. At the same time there was a significant increase in council properties. 1% of families rented council accommodation in 1914; by 1939 this had risen to 14%. In 1919 the Addison Housing Act required local government to build houses to be let to working-class families. This act was abolished in 1921, but other housing acts tended to encourage the construction of council homes: Chamberlain Housing Act (1923); Wheatley Housing Act (1924); and acts of 1930, 1933 and 1935. Between 1919 and 1939 central government provided subsidies for council housing totalling £208m toward the construction in England and Wales of 1,112,505 council houses and 430,327 private houses. In Scotland subsidies were provided for the construction of 212,866 council houses, and 43,067 private houses. With the expansion of rented council housing, the private rented sector contracted. The new houses were also better in quality than previous houses.
|
|
|
There was also a geographical change in the location of housing, with new developments in lower density suburbs. Often developments followed the introduction of a new metro line. In London the population of the centre decreased by 400,000 whilst that of the suburbs increased by 1.4m. In contrast to Victorian houses, the new houses tended to have front and back gardens, and were less cramped. This encouraged men to stay at home instead of going to the pub, and gardening became a popular pastime. There was also an increase in domestic hobbies such as model-railway building and radio-construction and building.
|
|
|
However, despite the volume of housing constructed during the inter-war period, there still remained a housing shortage in 1939. Slum houses had to be cleared, and in 1934 local authorities estimated that 333,268 houses were ready for demolition in Great Britain, and this estimate was revised upwards to 604,417 by 1939. The housing shortage was also exacerbated by the increase in the number of families - there was a trend towards smaller families. Between 1921 and 1938 the number of families in the UK increased by 3,515,000, which was greater than the increase in the population as a whole.
|
|
|
There were large numbers of unoccupied houses by 1938 - 363,000, but these were more expensive houses, and the shortage existed in lower end of the market. There was more construction of houses in the upper and middle ranges of the market.
|
|
|
Council housing also did not meet the demand from all sectors of the working class. Occupants of council houses tended to be clerks, tradesmen, skilled workers and the better-paid semi-skilled workers. Many people could only afford to rent a slum. Rowntree's study of York found that more than half the people living in slum accommodation did so because they could afford nothing else. The government estimated that there were 350,000 houses that were overcrowded in 1936, and others were unfit to live in. Sum clearance resulted in the demolition of 342,940 houses in Great Britain by 1939. However, in 1943 it was estimated that 40% of houses in Hull, and 90% of houses in Stepney were without baths. In 1946 12% of houses in Birmingham had no separate lavatories. Slum clearance was greatest in the areas of Victorian industrial activity - for example, London, Leeds, Manchester, Liverpool, Sheffield and Birmingham. Overcrowding was also greatest in such areas.
|
|
|
One effect of the new housing was to segregate society more according to class and income. In fact, the Town Planning Act of 1932 seemed to encourage this development by differentiating between different densities for housing construction.
|
|
Health |
|
During the interwar period there was an improvement in the general health of the nation. This is best indicated by the fall in general mortality rates: there were 14.7 deaths per 1000 of population in 1906-10, but 12.0 per 1000 during 1936-18. Rowntree's study of York also showed a drop in mortality rates, from 17.2 deaths per 1000 during 1898-1901 to 11.6 per 1000 during 1936-38. Infant mortality rates also fell — in Rowntree's study falling from 160.6 per 1000 during 1898-1901 to 54.6 per 1000 during 1936-38. For England and Wales as a whole infant mortality was 105 per 1000 in 1910, 60 per 1000 in 1930 and 56 per 1000 in 1940. There was a decline in the incidence of infectious diseases such as scarlet fever, diphtheria, whooping cough, measles, typhoid and tuberculosis. The increase in death rates from degenerative diseases such as cancer and heart disease reflected this decline. Life expectancy at birth improved from 51.5 years for men and 55.4 for women for those born in 1901-12 to 58.7 for men and 62.9 for women for those born in 1930-32.
|
|
|
However, maternal mortality rates did increase in England and Wales from 3.9 deaths per 1000 during 1921-25 to 4.3 in 1931-5. Nonetheless, the general trend was downwards, and maternal mortality rates had fallen to 3.26 deaths per 1000 by 1937.
|
|
|
The improvement was reflected in the fitness of men to fight: only 36% of conscripted men were fully fit in 1917-18 compared to 70% at the outset of the Second World War.
|
|
|
Some causes of improved health: (1) Improvements in the quality of the health service — both preventative and curative. Improvements in the expertise of the medical health profession. (2) Improvements in sanitation — supported by major legislation designed to improve water supplies, sanitation and the quality of housing. Crucial acts were Public Health Act (1936), the Factory Act (1937) and the Food and Drugs Act (1938). (3) Developments in health insurance. Legislation in 1911 introduced the National Heath Insurance scheme — it covered 19m wage-earners by 1936. Unemployed and sick workers were entitled to benefit and to some free medical services. (4) Increases in the number of doctors: 6.2 per 10,000 in 1911 rising to 7.5 per 10,000 by 1941 (5) Increases in the number of hospitals and hospital beds: 5.48 beds per 1000 in 1911 rising to 6.41 per 1000 in 1938. (6) Development of other health facilities: Welfare clinics were established as a result of the Maternity and Child Welfare Act of 1918, enabling 60% of children in England (and 69% of children in Wales) to be seen at 3,368 infant welfare centres by 1936. (6) Developments in drugs, particularly the development of sulphonamide drugs after 1935 used in the treatment of pneumonia, measles and scarlet fever.
|
|
|
However, probably the single largest cause of improved health was improvement in quality of food. This was also linked to better understanding of the vital role in health of vitamins and minerals. The improvement in nutritional largely explains why troops in the trenches of the First World War were able to survive on army rations. Sir John Boyd Orr published a report entitled Food, Health and Income in 1936. His figures indicated that consumption of staple foods such as potatoes had not declined since 1914, whilst consumption of meat, butter, eggs and cheese had risen by 50%. Additionally, consumption of vegetables had risen by 64% and fresh fruit by 88%.
|
|
|
However, the general improvement in health masked some very wide discrepancies, and there was a clear link between health and social class! For men between 20 and 64 in higher occupational classes the death rate was 10% below the national average; but for unskilled labourers the death rate was 11% above. In Rowntree's study of York in 1936 the death rate was 8.4 per 1000 for those above the poverty line, and 13.5 per 1000 below the poverty. Another link between health and income (or occupation) was through the ability to pay for health services. Additionally, women and children were not covered by the National Health insurance scheme. Further, poor people more frequently lived in overcrowded conditions, and were consequently more vulnerable to infectious diseases. The better the income of a family the more they could afford to spend on food, and consequently, the better and more balanced the diet! These were the conclusions of Sir John Boyd Orr's study, and that was why his report was controversial at the time. He wrote, "a diet completely adequate for health according to modern standards is reached only at an income level above that of 50% of the population." The inadequacies of the diet of poor people were the fault of poverty and not of the poor themselves: a study by Dr. M'Gonigle and others demonstrated that the poor spent a greater proportion of their income on food than wealthier groups, and that the selection of foods they made was the best they could achieve with the resources at their disposal. A lack of income meant that poor families consumed less meat, vegetables, fruit and milk than wealthier families. Women in poverty were more at risk than men because they tended to feed husbands and children first. It is possible that reductions in pay and benefits of the early 1930s was partly responsible for the increase in maternal mortality rates at that time.
|
|
|
Health also showed significant regional variations. For example, standardised death rates in 1938 were 24% above the national average in Galmorgan, 52% in Merthyr Tydfil, 34% in Wigan, 30% in South Shields and Jarrow, 30% in Durham; by contrast, in Surrey the death rate was 20% below the average. Since the worst affected regions were also those affected most by unemployment, and since unemployment causes a fall in income, the variations in death rates were probably largely caused by unemployment.
|
|
Cars and Transport |
|
Motor cars became more common and transformed social life. Private registrations increased from 200,000 in 1920 to 1 million in 1930 to nearly 2 million by 1939. There was no driving test until 1934, when speed limits of 30 miles per hour were introduced for built-up areas. As a proportion, there were a large number of motor accidents — number of deaths in 1934 from motor accidents was greater than the number of deaths in 1964. The motor car was used for day to day transport. Tax was based on horsepower, and hence encouraged smaller cars, as did the poor quality of the roads; hence there were a large number of cheap, low powered cars.
|
|
|
Buses started to replace trams. The first metropolitan district to remove tram-lines in favour of buses was Manchester in 1928. Passenger numbers on buses exceeded those on trams by 1932. Just as train lines before them, bus lines now changed the pattern of urban development. Residential building now developed along the bus routes and roads.
|
|
Radio |
|
Wirelesses became very popular. Meanwhile, attendance at churches, clubs, societies and pubs declined. People started to drink less. King George V inaugurated the broadcast of the Christmas message in 1932.
|
|
Education |
|
There were few developments in education. The school leaving age was not increased, although it was scheduled to increase to 15 on 1st September 1939! However, class sizes started to decrease — the number of primary classes with over 60 pupils declined and numbers with over 50 were also beginning to decline. Only 1/5th of the adolescent population received any form of secondary schooling. University education was equally stagnant, and the universities produced little of quality.
|
|
Advertising |
|
Newspapers were increasingly funded by revenue from advertising. Newspapers, consequently, became increasingly interested in large circulation figures, and Oldhams, the proprietors of the Daily Herald were the first to employ door-to-door canvassing in order to win new readers. As a result a great newspaper war commenced, with the Daily Herald, the Daily Mail, the Daily Express and the News Chronicle being at the forefront of the fray. Newspapers tried to lure readers with free gifts. The 'war' ended in 1933, by which time the Daily Herald and the Daily Express had increased their circulations to over 2 million; however, only the Daily Express kept this number.
|
|
|
Other journals exerted a significant influence, despite small circulations: Conservatives read the Spectator, radicals read the New Statesman, which was controlled by Keynes.
|
|
Sport |
|
Watching sport increased in popularity. Horse racing continued to be popular, and greyhound racing was introduced in 1926 as a cheap version of gambling for the lower classes. Cricket remained popular as a spectator sport without the added inducement of gambling. All classes were involved in association football.
|
|
Cinema |
|
The cinema became the essential social habit of the age. The music hall died out, provincial theatres went out of business; productions of Shakespeare were confined to the London Old Vic and Stratford upon Avon. There were very few worthwhile plays written or produced. Galsworthy died, John Drinkwater and Stephen Phillips slid into “oblivion”, and Shaw lost his touch; Noel Coward produced patriotic works of no consequence. The extent of the craze for the cinema is illustrated by statistics for Liverpool, where it is estimated that 40% of the population went to the cinema once a week, and 25% twice. The introduction of talking movies, after the release of The Jazz Singer in 1927, put an end to the period of the silent movie. The Americans dominated the production of movies, and the only two British directors of distinction during this period were Alfred Hitchcock, who worked in Hollywood, and Alexander Korda, who was an expatriate Hungarian. Movie showings were preceded by newsreels, which presented news in the same intense, dramatic way. This made political events seem unreal, and without connection to “real” life.
|
|
Religion |
|
Whilst England was theoretically a Christian country there was a decline in organised religion, and the only prime minister to be fully practising Christian was Baldwin.
|
|
Conclusion |
|
In Britain during the interwar period there was a general improvement in the quality of life for the majority of people. However, this improvement was not caused by government policy in the main. Government economic policy, for example, contributed to the worsening of the economic crisis of the 1930s.
|
|
|
Despite the popular image of the 1930s as a period of “black years”, “mass unemployment” and “appeasement”, most English people had a better standard of living, with higher real wages, shorter hours and longer holidays. They enjoyed new consumer products such as radio sets, cinemas, electrical appliances and motor cars.
|
|
|
The main cause of the improvement was changes in population structure. There was a fall in the birth rate that resulted in a reduction of the demands on the average family's income. Despite this, the government actually tended to discourage birth-control and family planning. The average family experienced an increase in disposable income, and as a consequence were able to spend more on food and consumer goods.
|
|
|
In conclusion, interwar Britain was a time of transition. Some Victorian social and cultural conventions were lost, with much of its industry, its housing and its social conditions. Britain moved towards the affluent mass consumer society she became after the Second World War.
|
|
|
However, there was not much change in the distribution of incomes. In 1936 81% of the nation's private capital was still owned by 5% of the population of England and Wales (over 25 years of age), and there had been little change in this structure since 1914.
|
|