|
Supply and elasticity of supply |
Supply |
|
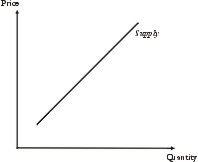
Supply works in a similar way to demand. It is assumed that suppliers seek to maximise profits. The higher the price of a good, the easier it is to make a profit. Consequently, suppliers will offer more and more of a good to the market as the price goes up. Thus, under normal conditions, the supply of a good will increase as the price increases. Supply is also strictly speaking supply per unit of time; although it is customary to omit this when referring to supply.
|
|
|
|
|
The supply curve
|
|
|
The supply curve is a relationship between price and quantity. That is, the graph shows how changes in price affect changes in the quantity supplied. Thus, a movement along the supply curve reflects the result of a change in price. Shifts in the supply curve from one position to another reflect changes in the conditions of supply.
|
|
|
|
|
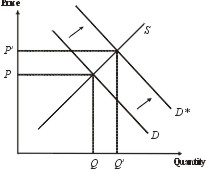
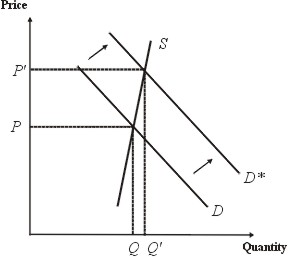
An improvement in the conditions of demand leads to an outward shift of the demand curve. This causes the price of the good to increase from P to and the quantity demanded to increase from Q to .
|
|
|
The result of this shift in the demand curve is a movement along the supply curve. The conditions of supply have not been altered.
|
|
|
Note, that it is customary to draw a straight-line for a supply curve; but this is a matter of convenience when dealing with diagrams of supply (and demand). There is no necessary reason why a supply curve should result in a straight-line (that is, linear) relationship between quantity supplied and price. In practice most supply curves will not be represented by straight lines.
|
|
Individual supply and market supply |
|
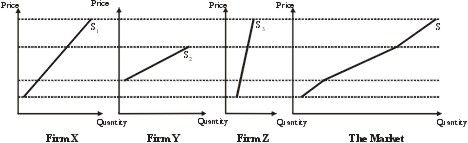
Just as the demand in a market results from adding together the demand curves of individuals, a market is supplied by individual firms. Each firm has a different supply curve — that is a relationship between the quantity the firm would seek to supply to a market at a given price. When these individual supply curves are added together, the result is the supply curve for the market (or industry, which here means the same thing as market).
|
|
|
|
|
Individual and market supply curves. For simplicity we imagine an industry supplied by just three firms, X, Y and Z. When their individual supply curves are added horizontally, the result is the industry (market) supply curve.
|
|
Factors influencing the conditions of supply |
|
Some of the factors that could affect the conditions of supply are as follows.
|
|
|
(1) Changes in the costs of production
|
|
|
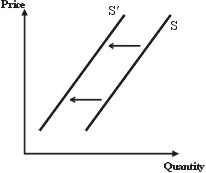
If the costs of raw materials or labour unit costs rise, then the supply curve will shift inwards; it will shift outwards if the costs of production fall.
|
|
|
|
|
Rising unit costs cause the supply curve to shift inwards. Less is supplied at any given price than before.
|
|
|
(2) Changes in technology
|
|
|
Improvements in technology, leading to increases in productive efficiency, will cause the industry supply curve to shift outwards — more will be supplied at every given price.
|
|
|
(3) Changes in the prices of goods in joint supply
|
|
|
Beef and leather are standard examples of goods in joint supply. Both goods arise from the slaughter of bulls. If the price of beef goes up, then the supply of leather will also increase.
|
|
|
There may be other factors that affect the supply of a good. For example, government legislation to reduce pollution and the weather may play a particular role. In addition, the influence of interest rates, and the expectations and plans of producers may play a role. The conditions of supply cannot be studied separately from those conditions that affect investment and supply in general, and should be examined in connection with supply side macroeconomics. (Macroeconomics is concerned with conditions affecting the performance of an economy as a whole.)
|
|
Elasticity of Supply |
|
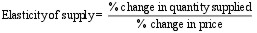
Just as we can define the elasticity of demand, so we can define the elasticity of supply. This is given by:
|
|
|
|
|
Or in symbols:
|
|

|
|
|
This is basically the same equation as the equation for price elasticity of demand.
|
|
|
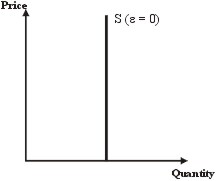
Perfectly inelastic supply occurs when there is no change in the quantity supplied to the market whatever the change in price.
|
|
|
|
|
Perfectly inelastic supply — elasticity is equal to 0 — and the supply curve is vertical.
|
|
|
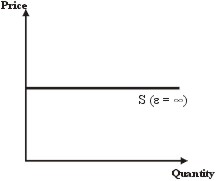
Perfectly elastic supply is results in a horizontal supply curve. The price charged is the same regardless of how much, or little, is supplied to the market.
|
|
|
|
|
Perfectly elastic supply — elasticity is infinite — and the supply curve is horizontal.
|
|
|
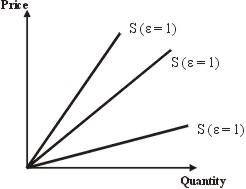
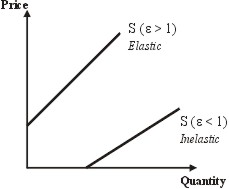
It is a curious outcome of the way in which the elasticity of supply is defined that for straight-line supply curves any supply curve (line) passing through the origin has elasticity equal to 1 . A line cutting the price axis above the origin has elasticity greater than 1 and is elastic. A line cutting the quantity axis to the right of the origin has elasticity less than 1 and is inelastic.
|
|
|
|
|
Unitary elasticity of supply. All these supply curves have unitary elasticity.
|
|
|
|
|
Elastic and inelastic supply. For straight-line supply curves, any curve cutting the price axis above the origin is elastic; any supply curve cutting the quantity axis to the right of the origin is inelastic.
|
|
Factors affecting elasticity of supply |
|
The longer the time period over which the quantity supplied is taken the more elastic supply is. This is a consequence of how the time period is defined.
|
|
|
Supply is elastic if it is easy to transfer resources in production from other goods to the good in question. For example, companies that produce dinner plates also tend to produce coffee mugs. It is a relatively easy thing to produce more mugs and fewer dinner plates.
|
|
|
A related question would be that of how easy it is for a company that does not produce dinner plates or coffee mugs to enter the market for either. This is concerned with entry barriers to the industry, and can be studied separately under market conditions. In other words, the market conditions affect the elasticity of supply, and the easier it is for companies to enter a market and produce a good or service, the more elastic the supply will be.
|
|
Profits and supply |
|
The housing market is an example of a market where supply at any given time will be inelastic. From start to finish, and including time required to obtain planning consent, it takes at least 2 years to build a new house. At any given time, the number of houses available for sale will be a small proportion of the total stock of houses in the country as a whole. Consequently, in the short run prices in the housing market are likely to be strongly influenced by changes in demand. During a boom, the demand for housing may increase in excess of the new supply, since decisions to build those new houses coming onto the market will have been taken at least two years before the boom began.
|
|
|
|
|
The Housing Market. In the short-run supply will be inelastic. Thus, an increase in demand will result in a large increase in house prices.
|
|
|
The increase in house prices represents an increase in profits for those builders that have completed new houses ready for the boom. These supernormal profits [1] act as a signal to other builders to construct new houses. They are attracted by the prospect of supernormal profits to build new houses. Unfortunately, for both them and for the house purchasers, since these new houses may take two or more years to be completed, the boom might be over by then. If that is the case, the influx of new houses two years later may result in a fall in house prices. [1. For the present we will define supernormal profits as simply unexpectedly large profits. This is not technically correct, but will serve in the present context.]
|
|
Supply and price fluctuations |
|
The above example concerning housing also illustrates how elasticity (or inelasticity) of supply can influence changes in prices. It is because the supply of houses in the short-run is inelastic that small changes in demand can cause large changes in prices. Consequently, the housing market is an example of a market where prices are more volatile — subject to changes. Where supply is elastic, prices are more stable.
|
|
