|
Elasticity of Demand |
Elasticity of Demand |
|
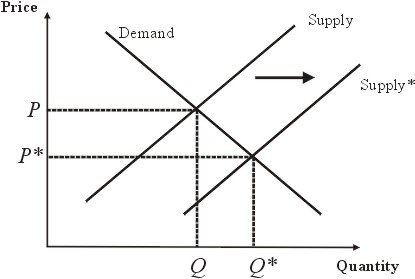
Consider the case where there is an increase in supply in a given market.
|
|
|
|
|
Supply shifts “outwards” as a result of, for example, companies opening new facilities. The result is that the price falls from , and quantity supplied rises from .
|
|
|
We can ask the question, what happens to profits in this case?
|
|
|
In fact, it is possible that profits will either increase or decrease. In the first instance this depends on the elasticity of demand.
|
|
|
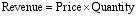
Now revenue is:
|
|
|
|
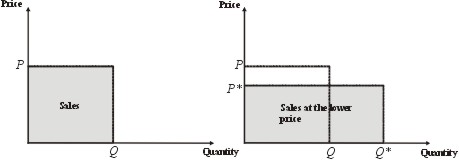
| Revenue (also called Sales, or Turnover) is represented in a graph as the following area.
|
|
|
|
|
When the price goes down sales (revenue) can in fact increase. This is because the rectangle representing
|
|
|
|
|
can be larger at the lower price than at the higher price.
|
|
|
|
|
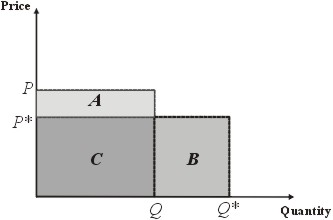
In the above diagrams the rectangle representing sales at the lower price is larger than the rectangle representing sales at the higher price. So a fall in price has led to an increase in sales. Another way to see this is illustrated by the following diagram.
|
|
|
|
|
Here the rectangle B is larger than A. The rectangle representing sales at the higher price is , whilst the rectangle representing sales at the lower price is . Since C is common to both sales figures, and B is larger than A, sales at the lower price are greater than sales at the higher price. So in this case a fall in price has resulted in an increase in sales. In this situation we call the demand “elastic”.
|
|
|
Demand is “elastic” when a fall in price leads to an increase in sales.
|
|

|
|
|
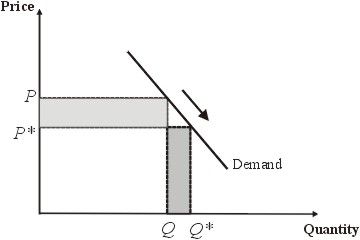
Here, a fall in price along a demand curve leads to an increase in sales. This is a situation of elastic demand.
|
|
|
|
|
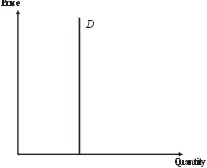
A perfectly inelastic demand curve. The quantity demanded remains the same regardless of what the price of the good is.
|
|
|
The increase in sales, however, does not necessarily mean an increase in profits. The increase in sales means that there is also an increase in costs, as more has to be produced. However, if the costs do not increase as much as the sales, then the fall in price will lead to an increase in profits.
|
|
|
However, when demand is “inelastic” then a fall in price leads to a decrease in sales, and consequently, must also lead to a decrease in profits.
|
|
|
Here a fall in price along a demand curve has lead to a fall in Sales (or Revenue). In this case the demand is said to be inelastic.
|
|
|
In summary: If the demand is elastic then a fall in price results in an increase in revenue, but as costs also increase the effect on profits is uncertain. It is possible that profits increase. If demand is inelastic then a fall in price leads to a fall in revenue and as costs also increase, the effect on profits is that they decrease.
|
|
“Perfect” elasticity and inelasticity |
|
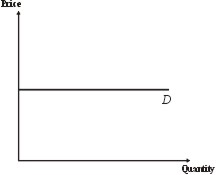
A “perfectly” elastic demand curve is horizontal, a “perfectly” inelastic demand curve is vertical
|
|
|
|
|
A perfectly elastic demand curve. The price remains the same regardless of the quantity supplied to the market.
|
|
|
|
|
A perfectly inelastic demand curve. The quantity demanded remains the same regardless of what the price of the good is.
|
|
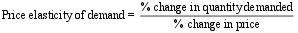
Price elasticity of demand |
|
Price elasticity of demand is a numerical measure of how the quantity demanded is affected by the price. It is defined to be
|
|
|
|
|
Or in symbols
|
|

|
|
|
Demand is elastic when ε>1. Demand is inelastic when ε<1.
|
|
Calculations involving elasticities |
|
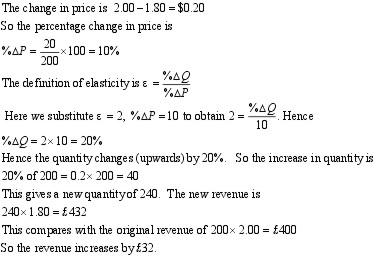
If you know the elasticity of your product then you can calculate the effect of a rise or fall in price on demand and revenue.
|
|
|
Example
|
|
|
|
Determinants of elasticity |
|
The following factors influence the elasticity of a demand curve.
|
|
| (1) | | The more substitutes a good has, then there more elastic the demand for that good becomes. |
| (2) | | How the good is defined will affect its elasticity. The narrower the definition, then the more elastic the demand. |
| (3) | | Elasticities of demand for many goods tend to be greater the longer the time period. |
|
|
|
It is very important for businesses to have some knowledge of the elasticity of
demand for their products, and this question of what determines the elasticity of
demand for a product is taken up in greater detail in a subsequent unit.
|
|
Changes in elasticity along a demand curve |
|
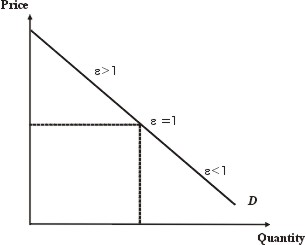
Elasticity of demand usually changes along a demand curve, and this is one of the properties of a demand curve that students find difficult to grasp at the beginning.
|
|
|
|
|
One naturally tends to think that because the demand curve here is linear (a straight line) that its elasticity must be constant all along the demand curve. But this is not so. Revenue will increase if price falls along the top part of the demand curve, and will increase with a fall in price along the bottom part of the curve.
|
|
|
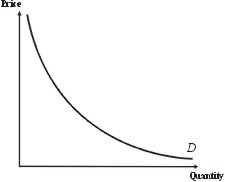
If a demand curve is required that has a constant elasticity, it turns out that it has the shape of a hyperbola.
|
|
|
|
|
Constant Elasticity
|
|
